BayesPrism Documentation
1 Login
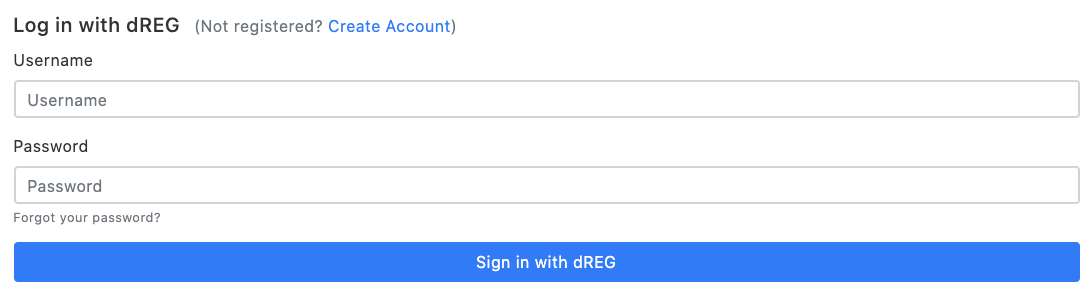
The user needs to log in by clicking 'Log in' link at the top-right corner of the page. Having an account provides a number of benefits, and is free and easy.
2 Create a new experiment
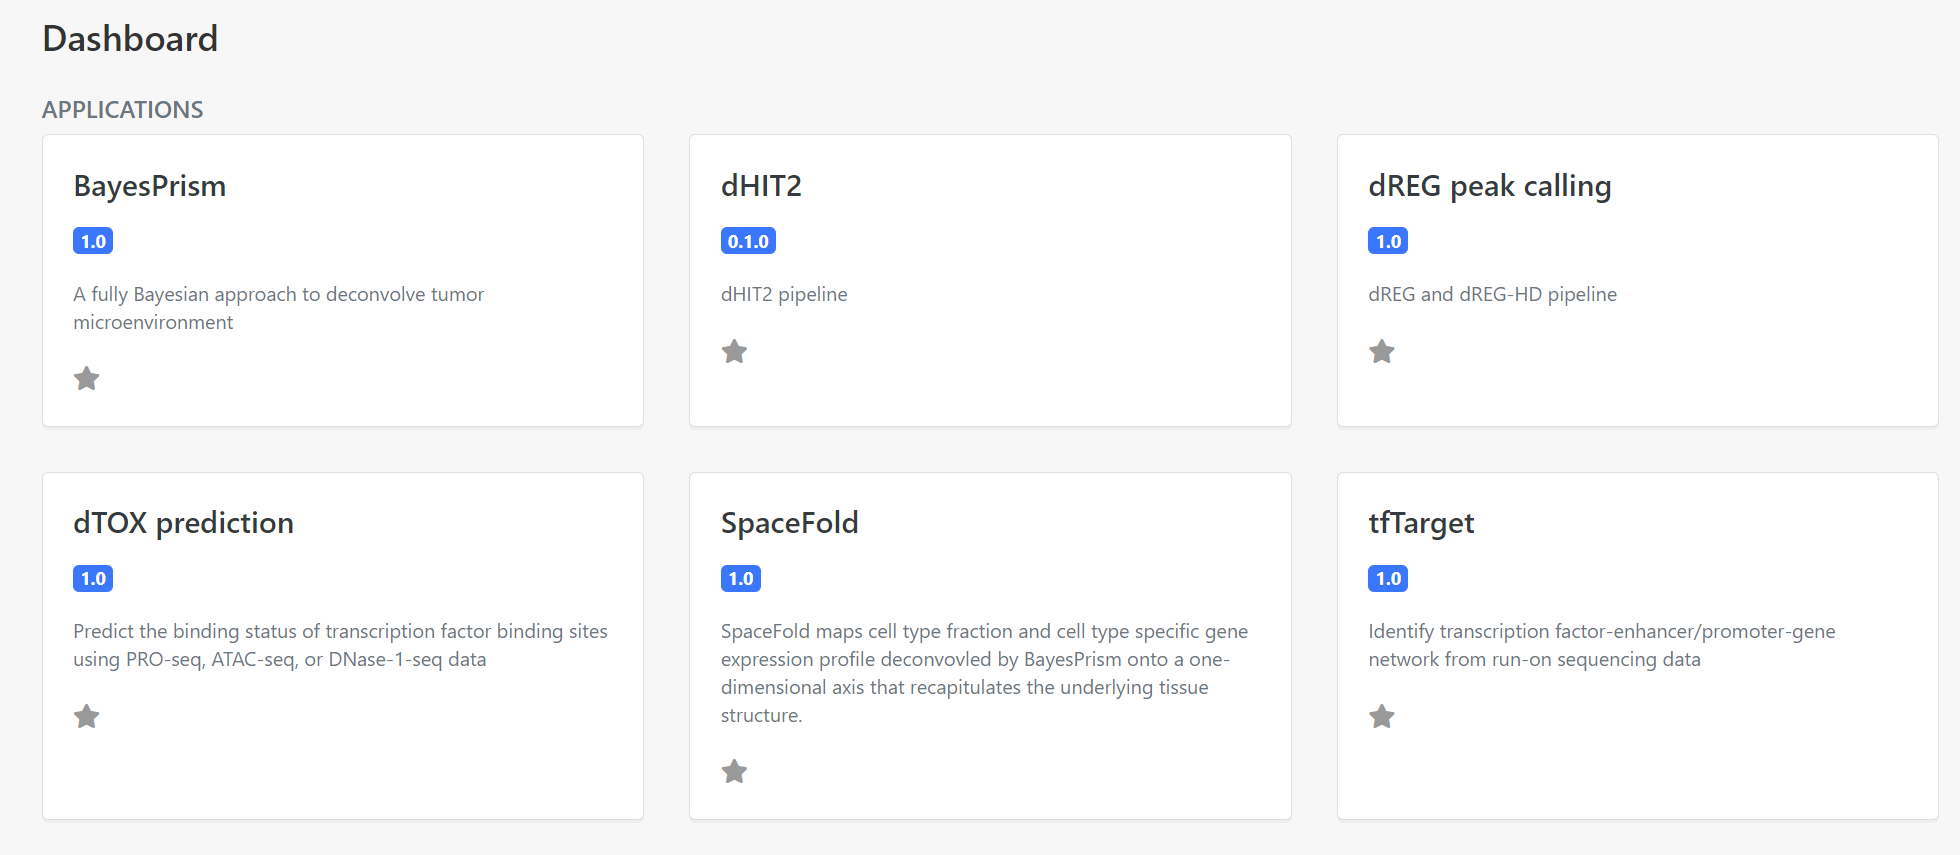
Select the BayesPrism application on the dashboard panel to create a data analysis for your data, as the following screenshot (Figure 2).
3 Set experiment name
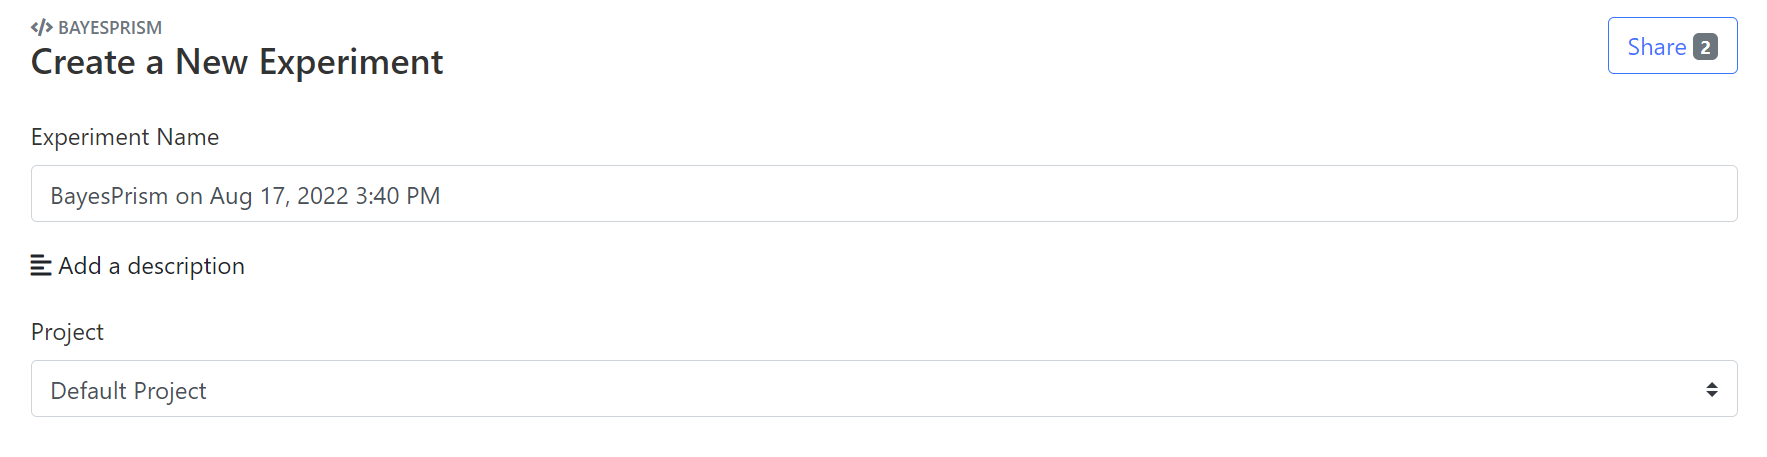
Rename Experiment Name, and click Add a description to comment on the experimental setup (optional). Choose the project that the experiment belongs to. By default, the "Default Project" is created and used.
4 Upload count matrix files
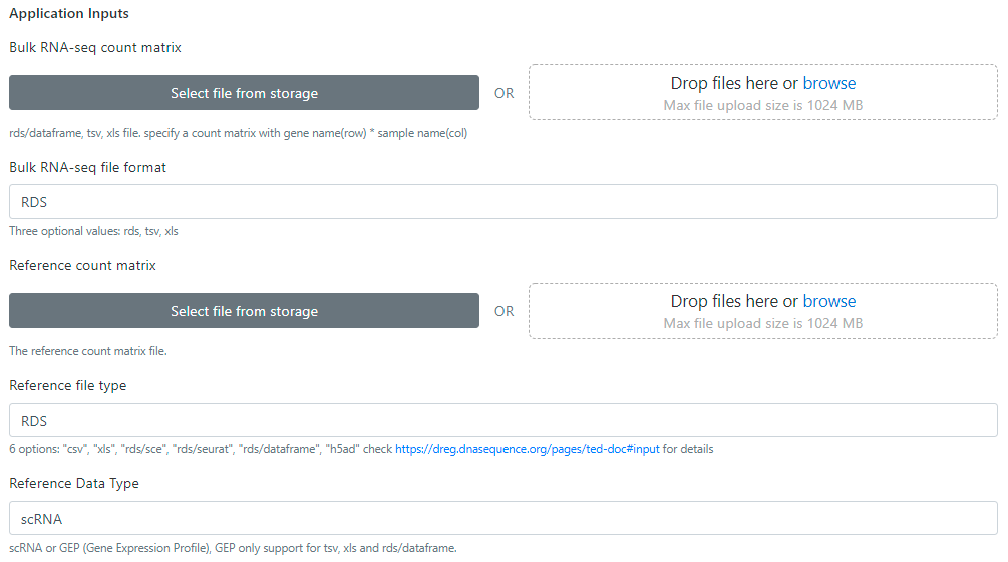
The bayesPrism need two types of count matrix file: the bulk RNA-seq count matrix and the reference count matrix. Currently we implement multiple data import from the dfferent data source, such as tsv, xls, rds/dataframe, rds/suerat, h5ad. For details please check the input tab of this page.
The gateway provides two ways to upload count matrix files for users. (1) Click "Select files from storage" to choose existing files submitted for previous tasks, or (2) click "Drop files here or browse" to upload new files from user's storage.
Note:
(1) Each row of count matrix indicates one unique gene id, so the count matrices should have same gene set in the bulk and in the reference.
(2) Count matrices can not be normalized
(3) At least 50 cells for each cell type are suggested.
5 Set computing parameters
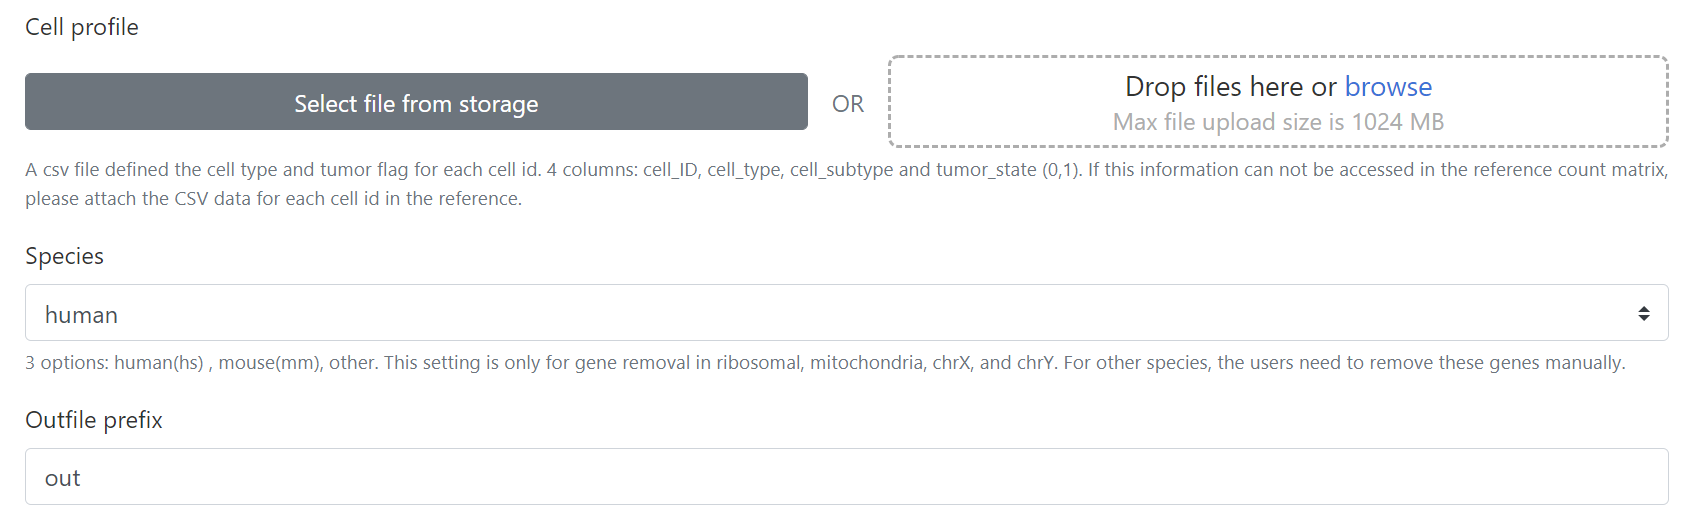
(1) Specify species for the gene removal in ribosomal, mitochondria, chrX, and chrY. For other species, the users need to remove these genes manually.
(2) Specify the cell type and tumor state for each cell sample in the reference count matrix using CSV format. 4 columns are defined: cell_id, cell_type, cell_subtype and tumor_state. The tumor state should be 0 (non-tumor) or 1(Tumor).
(3) Specify the prefix of the output files. This can help distinguish results from multiple experiments.
6 Submit the job
Once steps 1-5 are finished, proceed to "save and launch". Input data and parameters will be submitted to the computing node of the XSEDE cluster via the dREG gateway server. Click the checkbox next to "Receive email notification of experiment status" if needed.
Upon launching, users will be directed to the "Experiments" page, shown in Fig. 4. A typical experiment usually finishes within 4 hrs. Users may view the progress by logging in and clicking the "Experiment button on the left control panel at the dashboard.
7 Check the status
Users may view the progress by logging in and clicking the "Experiments" button on the left control panel at the dashboard. All experiments submitted are listed on this page.

8 Check the results
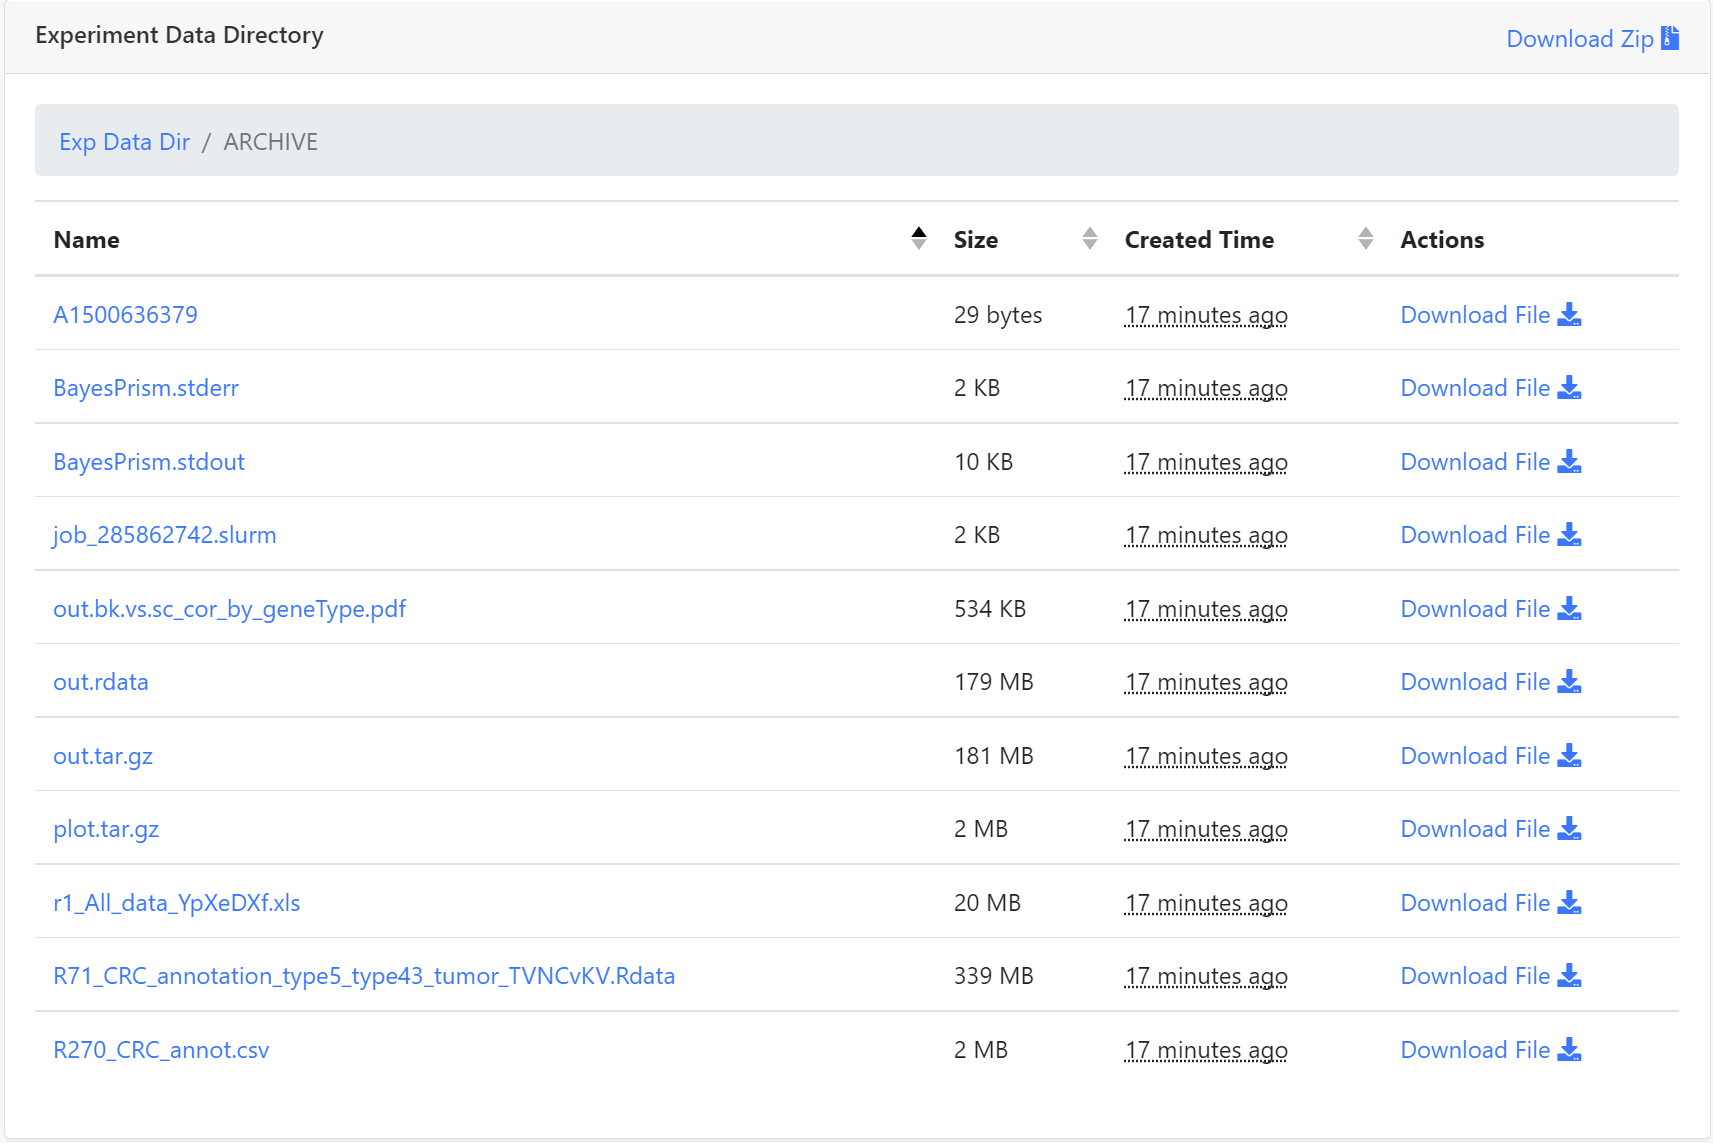
Once a job is completed, the user can click selected BayesPrism experiment and the website will jump to Experiment Summary page. All parameters used to set up the experiment are listed on this page. The user can also access output files of BayesPrism stored in the ARCHIVE. Just click the ARCHIVE to check any single result file. A compressed file, including input count matrix file set, two task log files and all result files, is also provided for users. Click Download Zip button to download a compressed file. The downloaded file with the 'tar.gz' extension can be decompressed by the 'tar' command, the file with the 'gz' extension can be decompressed by the 'gunzip' command in Linux.
In Safari, it could be problematic because Safari tries to unzip the compressed results automatically using a non-compatible compress method. Please check this link to disable this feature.
The input to BayesPrism consists of two count matrices which represent the read counts in bulk sample and in reference scRNA (or GEP). The count matrix file of scRNA or GEP can be exported from the single cell package, such as Seurat, CellRanger. Here we first explain the data format of count matrix used in BayesPrism.
1 Count Matrices
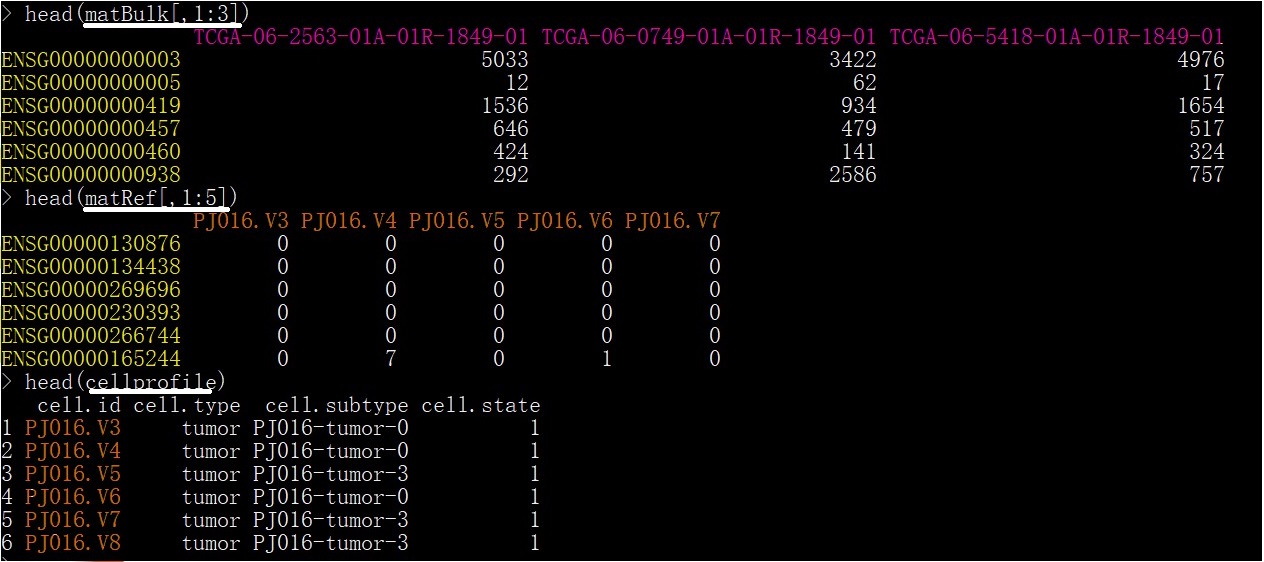
Two count matrices represent a bulk gene expression and a single-cell reference (scRNA or GEP). Both are coded with genes (rows) by samples (columns). The columns indicate the bulk individuals in a bulk matrix and the single cells in a single cell reference respectively. We demonstrate the data format in an R terminal as shown in Figure 1. It will help users understand the data format of a bulk matrix (matBulk) and a reference matrix (matRef). These two matrices can provide hyperlinks to the example input format here. In addition, the users should know:
(1) The bulk matrix and the reference matrix should use the same version of gene annotation.
(2) Ideally, raw count should be used for bulk and scRNA-seq input if possible. There is no need to normalize by library size. If raw count is not available, TPM and RPKM can also be used. Log transformation or VST transformed count should be avoided.
(3) In the reference matrix, it is recommended to use at least 50 cells for each cell state.
| Data Format | Used For | Description |
|---|---|---|
| TSV | Bulk,Reference | A tab-separated values file contains read counts for each gene (as row) in every sample (as column). Individual samples and cell samples are specified for the bulk matrix and the reference matrix respectively. BayesPrism requires TSV with row names and column names. BayesPrism takes the TSV header as column names and takes the first column as row names. |
| XLS | Bulk,Reference | An Excel file contains read counts for each gene (as row) in every sample (as column). BayesPrism taks the first row as sample (column) names and the first column as gene (row) names. |
| RDS/dataframe | Bulk,Reference | This RDS file is an R data frame conatins read counts for each gene (as row) in every sample (as column). BayesPrism requires the data frame should have row names (genes) and column names (samples). |
| RDS/sce | Reference | This RDS file contains a SingleCellExperiment object which repersents read counts for each gene (as row) in each sample (as column). |
| RDS/seurat | Reference | This RDS file contains a Seurat object which represents single-cell expression data for R. Each Seurat object revolves around a set of cells and consists of one or more Assay objects. |
| h5ad | Reference | Hierarchical Data Format version 5 (HDF5) is used to store both the expression values and associated annotations on the genes and cells in Python. H5AD format can be read into R as a SingleCellExperiment. |
2 Cell profile
If the reference matrix doen't contain the cell type and the tumor state for each cell, the users must provide a CSV file to indicate the cell type and tumor state for each cell. The CSV illustrated in Figure 1 (cellprofile) have 4 columns: cell id, cell type, cell subtype, and tumor state ( 0 for normal or 1 for tumor ).
3 Species
BayesPrism removes genes in ribosomal, mitochondria, chrX, and chrY before deconvolution. If the data is not for human and mouse, the users have to remove these genes manually.
4 scRNA or GEP
The reference matrix could represent scRNA data or GEP (Gene Expression Profile) data. GEP only support TSV, XLS, and RDS/datframe.
1 BayesPrism output files
BayesPrism generates a RDATA file ($PREFIX.rdata) for R users and a compressed file ($PREFIX.tar.gz) for Python users.
R users can open RDATA file using "load" commmand easily. Python users need to extract multiple RDS files (see the following table) using the decommpresion command "tar -xvzf" on Linux
Note: All files below are stored in the "ARCHIVE" directory.
| File name | Description |
|---|---|
| $PREFIX.rdata | This Rdata file contains the 'bp.res' object which can be explored by the 'str' command. |
| $PREFIX.tar.gz | The compressed file contains multiple RDS data which represent the items of the 'bp.res' object. |
| $plot.tar.gz | The compressed file contains all the plots that you may need. All plots are showed in the 4th part. |
| $out.bk.vs.sc.pdf | The plot indicates the concordance of gene expression for different types of genes. Note this only works for human data. For other species, you are advised to make plots by yourself. |
2 Contents in $PREFIX.rdata
| Name | Description |
|---|---|
| The input prism. | |
| bp@prism@phi_cellState@phi | The expression matrix in the format of cell states(rows) by genes(columns). |
| bp@prism@phi_cellType@phi | The expression matrix in the format of cell types(rows) by genes(columns). |
| bp@prism@map | The information of all the cell types and cell states. |
| bp@prism@mixture | The mean count of gene expression in each bulk sample. |
| The results of step2. | |
| bp@posterior.initial.cellState@Z | The estimation of the mean of posterior read count for each cell state in each bulk sample. |
| bp@posterior.initial.cellState@theta | The initial estimation of fraction for all cell state in each bulk sample. |
| bp@posterior.initial.cellState@theta.cv | The coefficient of variation (CV) of cell state fraction. |
| The results of step3. | |
| bp@posterior.initial.cellType@Z | The estimation of the mean of posterior read count for each cell type in each bulk sample. |
| bp@posterior.initial.cellType@theta | The initial estimation of fraction for all cell type in each bulk sample. |
| bp@posterior.initial.cellType@theta.cv | The coefficient of variation (CV) of cell type fraction |
| The updated reference ψ. | |
| bp@reference.update@psi_mal | The gene expression profile of each tumor sample. |
| bp@reference.update@psi_env | The gene expression profile of each non-tumor sample. |
| The results of step4. | |
| bp@posterior.theta_f@theta | The final estimation of fraction for all cell type. |
| bp@posterior.theta_f@theta.cv | The coefficient of variation (CV) of cell type fraction. |
| bp@control_param | The parameters to run BayesPrism. |
3 Read RDS results in Python.
Python users can use 'pyreadr' to read RDS file (https://stackoverflow.com/questions/40996175/loading-a-rds-file-in-pandas).
Here we briefly show how to read it in Python.
import pyreadr
result = pyreadr.read_r('bp.posterior.initial.cellType.theta.rds')
# Extract the pandas data frame. In the case of Rds there is only one object with None as key
df = result[None]
4 Tutorial and downstream analysis, please click this link .
dREG Gateway is online service that supports Web-based science through the execution of online computational experiments and the management of data. The items below are trying to answer qustions from the users
Q: How should I prepare count matrix files for bayesPrism use with the dREG gateway?
A: The input to BayesPrism consists of two input matrices which represent the raw read count in bulk samples and the single-cell RNA-seq reference which can be supplied as either cell-by-gene raw count matrix (Reference Data Type=count matrix) or user-generated cell state-by-gene expression profile (Reference Data Type=GEP). Our gateway allows the count matrix or GEP describing the scRNA-seq reference to be exported from other single cell packages, such as Seurat and CellRanger. The details of the data format for the input matrices are described in the input tab of the documentation.
Q: How should I do when I meet the computational failure in the dREG gateway?
A: Firstly, please make sure that the input data meet the requirements, which you can found in the input tab of the documentation.
Here are some common causes of computational failure.
(1). Wrong file format. For details, please check the input tab of this page.
(2). Reverse rows and columns when submitting a count matrix file. BayesPrism needs two count matrixes, both of which are coded with genes(rows) by samples(columns).
(3). The data you submit cannot be calculated by BayesPrism. Here are some requirements. a) Each row of the count matrix indicates one unique gene id, so the count matrices should have the same gene set in the bulk and the reference. b) Count matrices are not normalizable. c) At least 50 reads for each cell type are suggested. d) It is recommended that at least one non-tumor sample be included in the cell profile.
Q: Which browser works well with the dREG gateway?
A: We have tested in the Firefox, Google Chrome and Safari so far. For IE (version 10 or 11) and some version of Safari, you maybe have trouble showing sequence data in WashU genome browser. For Safari users, please read next Q&A.
Q: What should the Safari users be aware of?
A: By default, Safari unzips a zip file automatically when you download it. However dREG results are compressed by the 'bgzip' command which is not compatiable with the Safari method. It would be probelmatic when you download dREG results. Please refer to this link to disable this feature in Safari and then download the compressed results from dREG gateway. Secondly, when you click the genome browser link, please use the Left-Click, don't use Right-Click menu and the menu option "open a new tab".
Q: How long do my data and results keep in the dREG gateway?
A: One month.
Q: Do I have to create account before using this service?
A: Yes, this system is supported by an NSF funded supercomputing resource known as XSEDE, who regularly needs to report bulk usage statistics to NSF. Nevertheless, data that you provide are completely safe.
Q: How do I know the status of the computational nodes?
A: Since we can't update this web site very often, the gateway status is updated here on the dREG page based on the notifications of the XSEDE community.
Q: Who do I thank for the computing power?
A: This web-based tool is powered by SciGaP and Apache Airavata and the GPU servers are supported by the XSEDE.
Q: I have another question that is not on this FAQ. How can I contact you?
A: Yes, please contact us with any questions! Zhong(zw355 at cornell.edu). Charles(cgd24 at cornell.edu).